
Desktop Graffiti: Collaborative Sensemaking on the Lab Bench
In traditional science classrooms, lab tables often function as static surfaces to hold heavy textbooks, store glassware, or record rigid procedural steps in paper notebooks (Hofstein & Lunetta, 2004). Transforming these physical bench spaces into dynamic modeling tools fundamentally shifts classroom culture (Windschitl et al., 2018). Desktop Graffiti is a pedagogical strategy in which students use dry-erase or liquid-chalk markers to sketch, calculate, debate, and iterate directly on the lab bench.
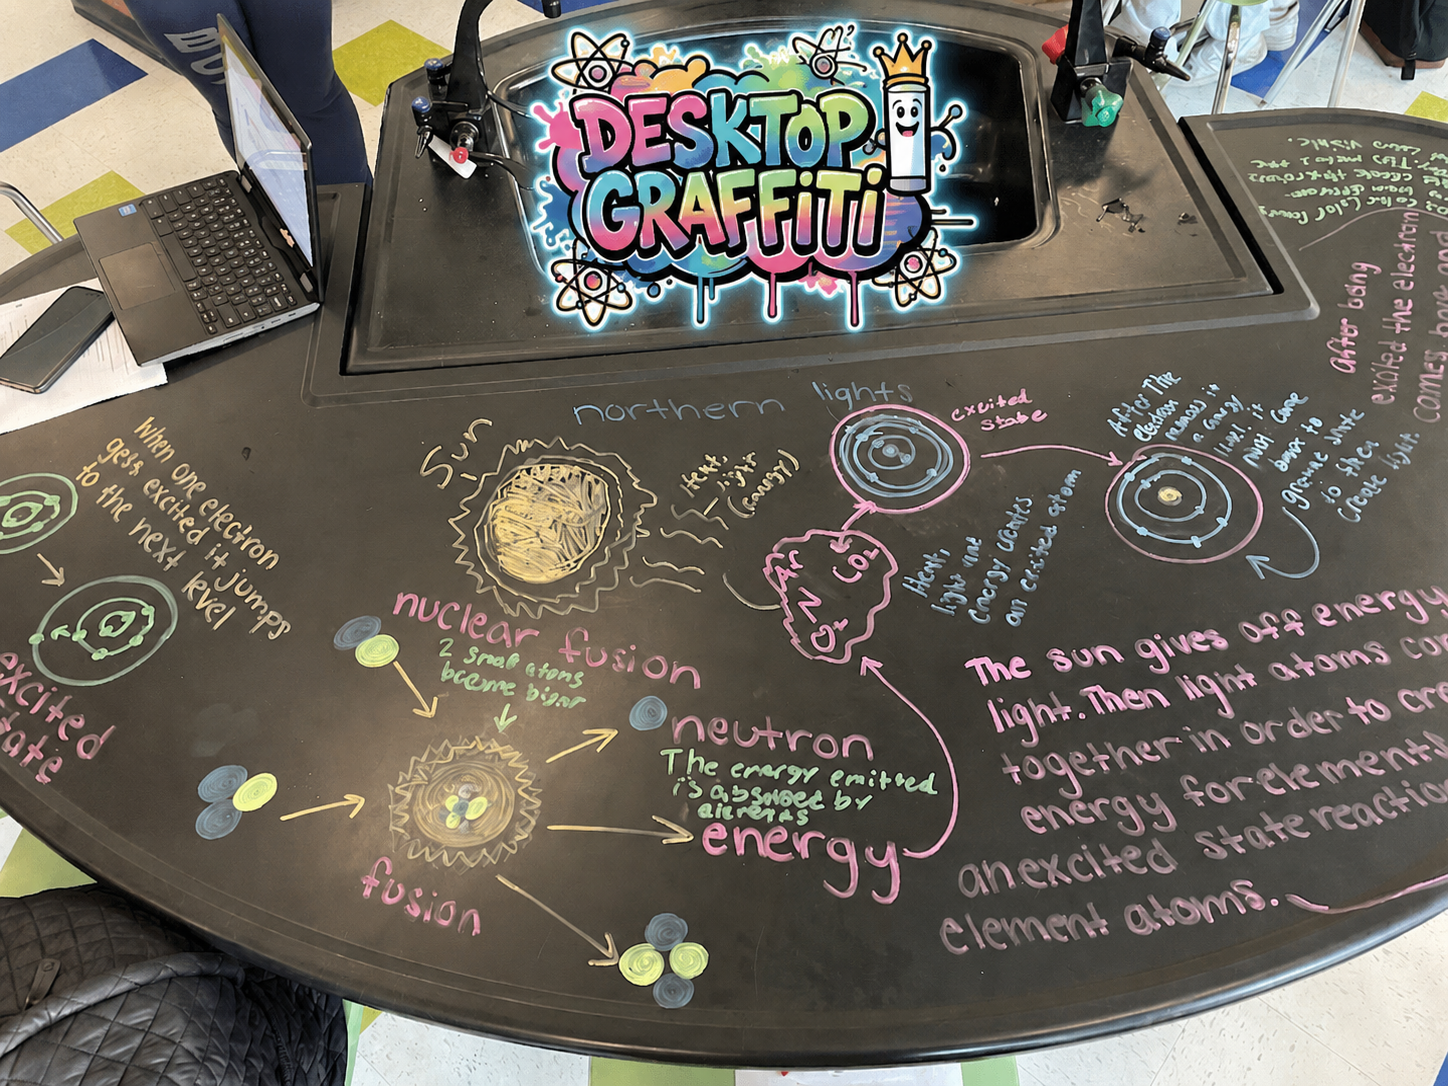
An example of students using desktop graffiti for their final model in Unit 1: The Northern Lights. Photo courtesy of Matt Barone © 2025.
Because traditional whiteboards are often viewed as formal presentation spaces, writing directly on the benchtop lowers cognitive risk due to the ease of erasing mistakes (Deakyne, 2015). Teachers can implement this practice informally during short warm-up brainstorms or formally as a structured, multi-step modeling protocol throughout an investigation (Schwarz et al., 2009).
The Core Pillars of Desktop Graffiti
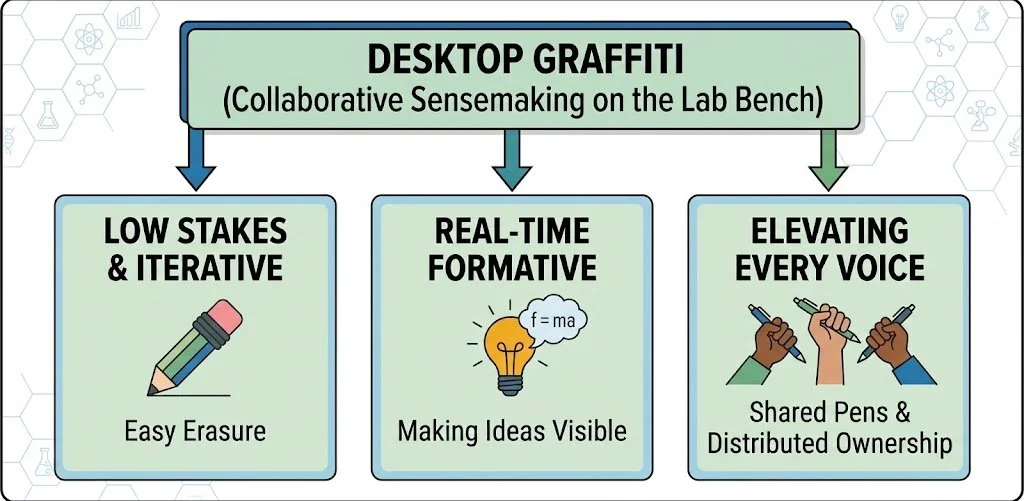
Core pedagogical principles of desktop graffiti, highlighting how non-permanent collaborative writing reduces anxiety, surfaces thinking in real time, and promotes equitable group participation.
Low Stakes & Iterative (Easy Erasure): Because marks wipe away in seconds using a paper towel or rag, anxiety around making errors disappears (Deakyne, 2015; Liljedahl, 2021). Students actively refine conceptual models without facing permanent academic risk (Passmore & Svoboda, 2012).
Real-Time Formative Assessment (Making Ideas Visible): Instructors can evaluate an entire room of students in seconds (Black & Wiliam, 2009). Misconceptions, emerging consensus, and hypotheses become visible instantly, enabling on-the-fly teacher interventions and gallery walks (Keeley, 2015; Ramirez, 2020).
Elevating Every Voice (Shared Pens & Distributed Ownership): Equipping every team member with a marker prevents single-student dominance over group work (Cohen & Lotan, 2014; Penuel et al., 2018). Ownership becomes communal, inviting simultaneous contributions and active discourse (Mercer & Littleton, 2007
Why Desktop Graffiti Works: Grounded in Sensemaking Research
1. Making Thinking Visible for Public Reasoning
Sensemaking is fundamentally a social and cognitive process (National Science Teaching Association [NSTA], 2023; Odden & Russ, 2019). For students to refine their understanding of an anchoring phenomenon, initial mental models must be exposed to open examination, questioning, and revision (NGSS Lead States, 2013).
As Windschitl, Thompson, and Braaten (2018) emphasize in Ambitious Science Teaching, public representations of thinking serve as "tools for reasoning." When students draw initial models on the desktop, peers and roaming teachers gain an immediate visual line of sight into current explanatory ideas, missing links, and underlying misconceptions without waiting for a formal lab report.
Cognitive Offloading: Externalizing complex mental representations onto the table frees up working memory, allowing students to process abstract cause-and-effect relationships more effectively (Kirsh, 2010; Sweller, 2011).
Public Discourse: When an idea is physically drawn between peers on a table, critiques focus on the visual artifact rather than the individual (Berland & Reiser, 2009). This subtle shift fosters productive disagreement and collaborative consensus building (Driver et al., 2000).
2. Lowering the Stakes for Iterative Modeling
In an NGSS-aligned classroom, models serve as dynamic, explanatory tools that evolve as new evidence surfaces rather than static, polished illustrations (National Research Council [NRC], 2012; Schwarz et al., 2009). Traditional paper worksheets often impart a sense of permanence that deters students from modifying original ideas.
Desktop Graffiti leverages the temporary quality of dry-erase and chalk markers. Since lines or labels wipe away instantly, students display greater willingness to test initial hypotheses, explore spatial representations, and embrace the iterative nature of scientific modeling (Liljedahl, 2021).
3. Elevating Every Student's Voice and PerspectiveEquitable engagement remains a foundational objective of Next Generation Science Standards implementation (Penuel et al., 2018). In standard small-group tasks, a dominant student frequently controls the single pencil and paper, directing the output while quieter peers disengage.
Desktop Graffiti addresses this imbalance through distributed physical access:
Expanded Workspace: The entire tabletop functions as a shared canvas, eliminating physical crowding.
Simultaneous Input: Distributing markers to all group members encourages multimodal participation, enabling students to label, draw arrows, map systems, or write questions concurrently (Cohen & Lotan, 2014).
Multimodal Honoring: The method accommodates diverse learning styles; multilingual learners and students who struggle with dense text can convey complex mechanisms using visual symbols and diagrams (Lee et al., 2013).
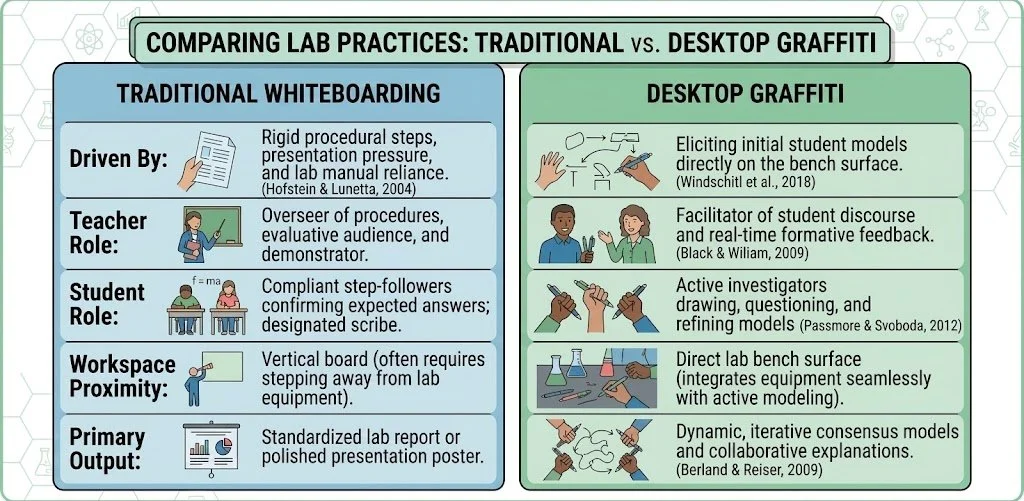
Desktop Graffiti vs. Traditional Whiteboarding
While both strategies externalize student thought, Desktop Graffiti offers distinct pedagogical advantages during specific phases of a lesson.
Implementing Desktop Graffiti in 3 Simple Protocols
To maximize sensemaking and avoid visual chaos, structure Desktop Graffiti with clear instructional purpose:
Protocol 1: The Initial Phenomenon Model (Formative)
Prompt: Present a puzzling chemistry phenomenon, such as an unexpected temperature drop during a dissolution reaction or the sudden formation of a colored precipitate.
Drafting (5 mins): Each student at the bench uses a distinct marker color to illustrate unobservable particulate interactions, energy transfers, or bond breakages (Windschitl et al., 2018).
Consensus Overlay (5 mins): Students negotiate similarities and differences directly on the table, circling agreed-upon representations in white and marking areas of uncertainty with question marks (Schwarz et al., 2009).
Protocol 2: Table-Hop Gallery Walk (Peer Discourse)
Freeze: Groups leave completed desktop models displayed on their benches.
Rotate: Teams rotate to adjacent lab tables equipped with sticky notes or a designated "Comment Corner" drawn on the desk surface (Ramirez, 2020).
Annotate: Visiting students write questions (e.g., "Where is the thermal energy transferring from?") or request additional evidence around the host group's model using a distinct neon marker (Reiser et al., 2017).
Protocol 3: The Evidence Bridge (Synthesizing Data)
Setup: Following a chemical investigation or digital simulation, student groups draw two large areas on their bench: [Our Initial Model] and [New Data/Evidence].
Connect: Using arrows and color-coded annotations, students map how fresh qualitative or quantitative evidence directly supports, refutes, or forces a revision of their original desktop model (Berland & Reiser, 2009).
Practical Chemistry Examples
Example 1: Eliciting Particulate-Level Initial Models (Thermochemistry)
Before analyzing endothermic and exothermic dissolution, students draw particulate-level representations of solid calcium chloride dissolving in water directly on the bench (Windschitl et al., 2018). Using different marker colors, they map water molecules, ion-dipole interactions, and relative kinetic energy before and after mixing. As temperature sensor data accumulates during the lab, students return to the tabletop to erase, adjust solute-solvent interactions, and refine energy-transfer arrows (Schwarz et al., 2009).
Example 2: Working Through Stoichiometry and Limiting Reactants
When tackling complex quantitative relationships such as limiting reactant calculations or gas law relationships, students lay out the mathematical workflow collaboratively on the desk (NGSS Lead States, 2013).
Collaborative Problem Solving: One student maps out the molar mass conversions, a second balances the chemical equation and identifies mole ratios, and a third carries out dimensional analysis across the bench surface (Cohen & Lotan, 2014).
Error Tracking: If the calculated percent yield exceeds 100%, students avoid erasing the calculation. Instead, they annotate in a contrasting marker color to trace where a unit conversion, stoichiometric ratio, or measurement error occurred, making their quantitative reasoning fully transparent (Leahy & Sweller, 2011).
Example 3: Planning a Reaction-Rate Investigation (Kinetics)
Rather than completing a pre-printed laboratory worksheet, student groups use the lab bench to design an experimental protocol testing factors that affect reaction rates, such as concentration or temperature (NGSS Lead States, 2013).
Variable Mapping: Students outline system boundaries directly on the desk, designating explicit zones for independent variables, controlled parameters, and collision-frequency diagrams (Passmore & Svoboda, 2012).
Equipment Mock-Ups: Groups place volumetric flasks, gas syringes, or colorimeters directly onto the table, drawing arrows, timing intervals, and reaction-rate equations around the physical glassware to visualize setup steps and safety protocols.
Peer Feedback: Neighboring groups conduct a brief two-minute table swap, using a distinct marker color to write safety questions or procedural suggestions directly adjacent to the experimental design (Ramirez, 2020).
Practical Implementation Suggestions
To maximize the pedagogical value of Desktop Graffiti while maintaining classroom order and lab safety, consider these strategies:
Select Appropriate Tools: Test markers on a discreet corner of lab tables beforehand. Fine-tip dry-erase markers excel at detailed structural formulas, whereas liquid chalk markers offer vibrant contrast on dark epoxy resin or black slate benches.
Establish Clear Boundaries: Explicitly define where writing is permitted. Remind students that desktop graffiti is reserved for scientific modeling, calculations, and sensemaking rather than personal doodling.
Assign Marker Colors: Assign every student in a small group a distinct marker color. This allows teachers to track individual contributions to a shared model during formative walkthroughs (Cohen & Lotan, 2014).
Capture Iterations Digitally: Prior to clearing tables at the end of a lesson, have students photograph their work using a tablet or phone to upload into digital lab notebooks or portfolio logs (Pilgrim & Bledsoe, 2015).
Streamline Cleanup Routines: Place microfiber cloths or damp paper towels at each lab station. Build in a designated 90-second cleanup routine at the end of class so surfaces are pristine for subsequent periods.
The Path Forward: Unlocking the Bench
Transitioning from "covering science content" to "figuring out phenomena" requires removing barriers that keep student thinking hidden (Windschitl et al., 2018). Desktop Graffiti serves as a research-backed, highly equitable approach that democratizes the lab environment (Penuel et al., 2018). By transforming the lab bench into an active canvas for collaboration, educators signal to students that their emerging ideas, preliminary drafts, and creative insights form the foundation of scientific understanding.
References
Berland, L. K., & Reiser, B. J. (2009). Making sense of argumentation and explanation. Science Education, 93(1), 26-55.
Black, P., & Wiliam, D. (2009). Developing the theory of formative assessment. Educational Assessment, Evaluation and Accountability, 21(1), 5-31.
Cohen, E. G., & Lotan, R. A. (2014). Designing Groupwork: Strategies for the Heterogeneous Classroom (3rd ed.). Teachers College Press.
Deakyne, A. (2015). Low-stakes writing in the STEM classroom: Decreasing anxiety and increasing engagement. The Science Teacher, 82(4), 31-36.
Driver, R., Newton, P., & Osborne, J. (2000). Establishing the norms of scientific argumentation in classrooms. Science Education, 84(3), 287-312.
Hofstein, A., & Lunetta, V. N. (2004). The laboratory in science education: Foundations for the twenty-first century. Science Education, 88(1), 28-54.
Keeley, P. (2015). Science Formative Assessment, Volume 1: 75 Practical Strategies for Linking Assessment, Instruction, and Learning (2nd ed.). Corwin Press.
Kirsh, D. (2010). Thinking with external representations. AI & Society, 25(4), 441-454.
Lee, O., Quinn, H., & Valdés, G. (2013). Science and language for English language learners in relation to Next Generation Science Standards and with implications for Common Core State Standards for English language arts and mathematics. Educational Researcher, 42(4), 223-233.
Leahy, W., & Sweller, J. (2011). Cognitive load theory, transients, and the transient information effect. Applied Cognitive Psychology, 25(6), 943-951.
Liljedahl, P. (2021). Building Thinking Classrooms in Mathematics, Grades K-12: 14 Teaching Practices for Enhancing Learning. Corwin Press.
Mercer, N., & Littleton, K. (2007). Dialogue and the Development of Children's Thinking: A Sociocultural Approach. Routledge.
National Research Council (NRC). (2012). A Framework for K-12 Science Education: Practices, Crosscutting Concepts, and Core Ideas. The National Academies Press.
National Science Teaching Association (NSTA). (2023). Sensemaking in the Science Classroom. NSTA Press.
NGSS Lead States. (2013). Next Generation Science Standards: For States, By States. The National Academies Press.
Odden, T. O. B., & Russ, R. S. (2019). Defining sensemaking: Bringing clarity to a fragmented theoretical construct. Science Education, 103(1), 187-205.
Passmore, C., & Svoboda, J. (2012). Exploring essential features of model-based inquiry for science classrooms. Science & Education, 21(10), 1533-1551.
Penuel, W. R., Turner, J. A., & Jacobs, J. R. (2018). Designing for equity in Next Generation Science Standards implementation. Journal of Science Teacher Education, 29(7), 612-632.
Pilgrim, J., & Bledsoe, C. (2015). Digital notebooks in the interactive science classroom. Journal of Adolescent & Adult Literacy, 58(8), 640-649.
Ramirez, G. (2020). Classroom gallery walks: Making thinking public in science. The Physics Teacher, 58(3), 180-183.
Reiser, B. J., Novak, M., & McGill, T. W. (2017). Co-designing Next Generation Science Standards storyline units to support student sensemaking. Science Education, 101(4), 540-562.
Schwarz, C. V., Reiser, B. J., Davis, E. A., Kenyon, L., Achér, A., Fortus, D., ... & Krajcik, J. (2009). Developing a learning progression for scientific modeling: Making scientific modeling accessible and meaningful for learners. Journal of Research in Science Teaching, 46(6), 632-654.
Sweller, J. (2011). Cognitive load theory. In Psychology of Learning and Motivation (Vol. 55, pp. 37-76). Academic Press.
Windschitl, M., Thompson, J., & Braaten, M. (2018). Ambitious Science Teaching. Harvard Education Press.
